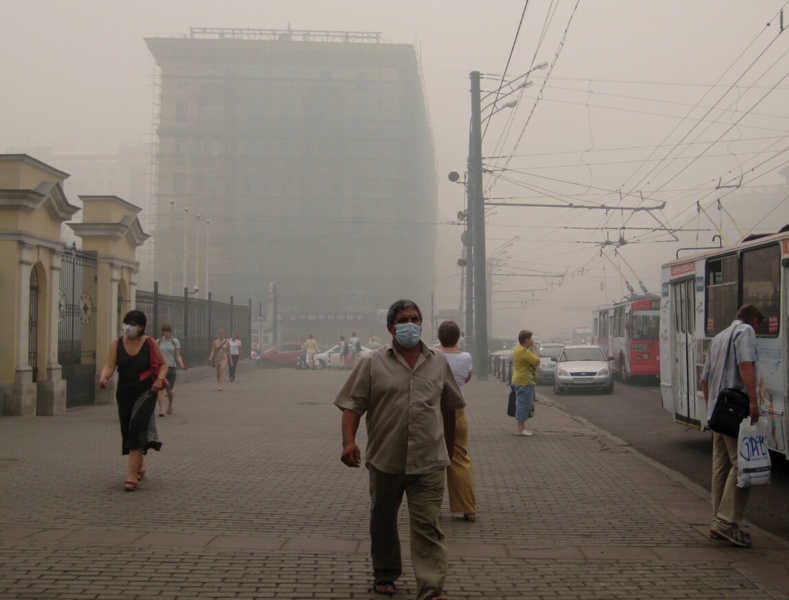
Many Muscovites wore masks in August 2010 when a heat wave--accompanied by smog and smoke from nearby wildfires--gripped the Russian capital. The city's mortality rate doubled as the concentration of atmospheric carbon monoxide soared to more than double acceptable safety norms.
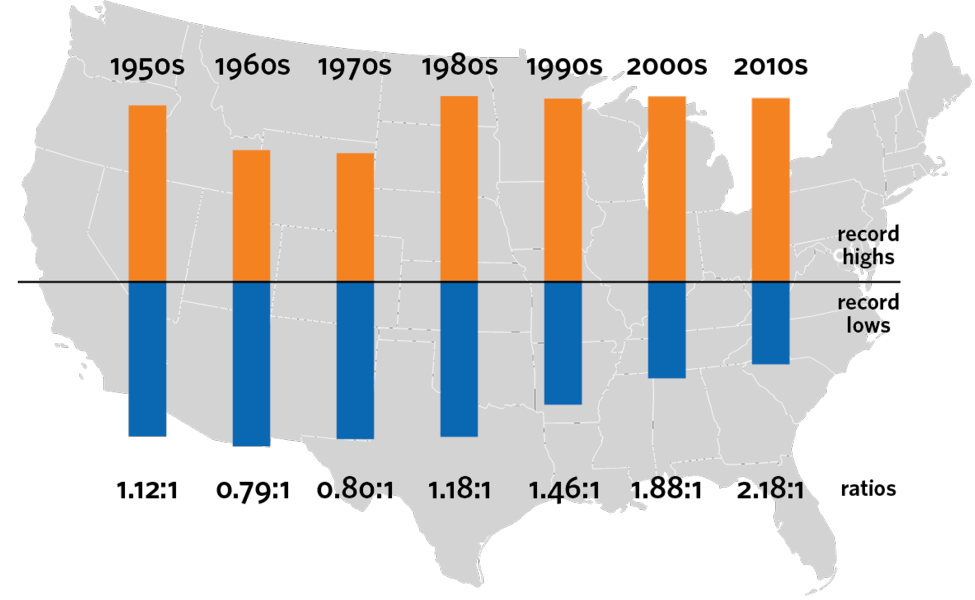
For the contiguous United States, the last 50 years have seen an increasing proportion of daily record highs to record lows, as reflected in data from about 1800 weather stations. The ratio shown for the 2010s covers the period from 2010 to 2017. (Guy Walton, based on NOAA observations)
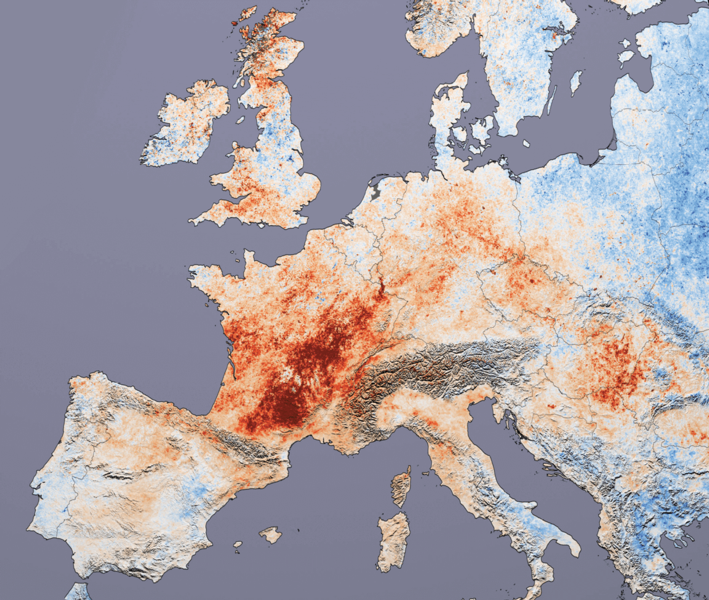
Maps from the 2017 Climate Science Special Report showing projected changes in the number of days that will soar above 90°F (left) or drop below 32°F (right) by the middle of this century (2036–2065, compared to 1976–2005), based on the average result from a variety of climate models using scenario RCP8.5. (U.S. National Climate Assessment/NOAA National Climatic Data Center/Cooperative Institute for Climate and Satellites, North Carolina)